In fall 2025, TI Ukraine's Transparent Cities program launched a new study: the European City Index. Its aim was to assess how ready Ukrainian city councils are to meet EU integration requirements for transparent democratic governance. It did this by analyzing their practices in access to information, accountability, and public participation.
Objectives of the pilot study:
- Select the priority areas of city council activity that the European City Index would be calculated on.
- Formulate indicators to assess how effectively local self-government bodies perform in each priority area.
- Develop measurement methods, including tools for automated indicator assessment.
- Assess how well the pilot cities implement the indicators in each area.
- Calculate the European City Index for the pilot sample from the scores in individual areas.
- Test the pilot study's assessment approaches on a wider sample of Ukrainian cities.
- Develop recommendations and practical tools for city councils to further develop European practices of access to information, accountability, and public participation.
The new product marks a logical step in the evolution of Transparent Cities research. The program is moving away from the sometimes formal assessment of regulatory compliance in the Transparency Ranking of the 100 Largest Ukrainian Cities. In its place, it applies more dynamic, automated, and comprehensive analysis. Experts believe this approach drives higher-quality change and supports the development of cities. That includes informing what Ukrainian cities should look like in wartime today and in their European future.
At a glance:
- Over the course of a year (October 2025 – July 2026), analysts examined six areas of local self-government (subindices) in turn: openness of city councils; e-services; open data; public finance; integrity and anti-corruption; accountability.
1) openness of city councils
2) e-services
3) open data
4) public finance
5) integrity and anti-corruption
6) accountability.
- The pilot sample comprises 11 cities: ten regional centers (Dnipro, Zaporizhzhia, Kropyvnytskyi, Lutsk, Lviv, Odesa, Poltava, Kharkiv, Khmelnytskyi, Chernihiv) and Kyiv. The selected cities represent all of Ukraine's macro-regions and every transparency level in the 2024 Transparency Ranking. They also cover a range of wartime contexts, from rear-area cities to cities designated as territories of potential hostilities.
- Each of the six subindices, which cover separate areas of local government activity, was assessed using 40 indicators, with a maximum city score of 100 points per subindex. The indicators were aligned with three sets of sources: the key documents setting out requirements and recommendations for Ukraine on its EU integration path, relevant sectoral documents, and relevant international research methodologies (see the full study methodology here).
- A methodological principle applied across all subindices was the “single point of entry,” which draws on the European approaches of user-centricity and one-stop shops. Under this principle, official city council websites should maintain permanent thematic sections that bring together, organize, and regularly update all reference information on a given topic. These sections should also provide working links to relevant internal and external documents and resources.
- Each subindex contributed equally to a city's final Euroindex score (weighting factor: 0.167).
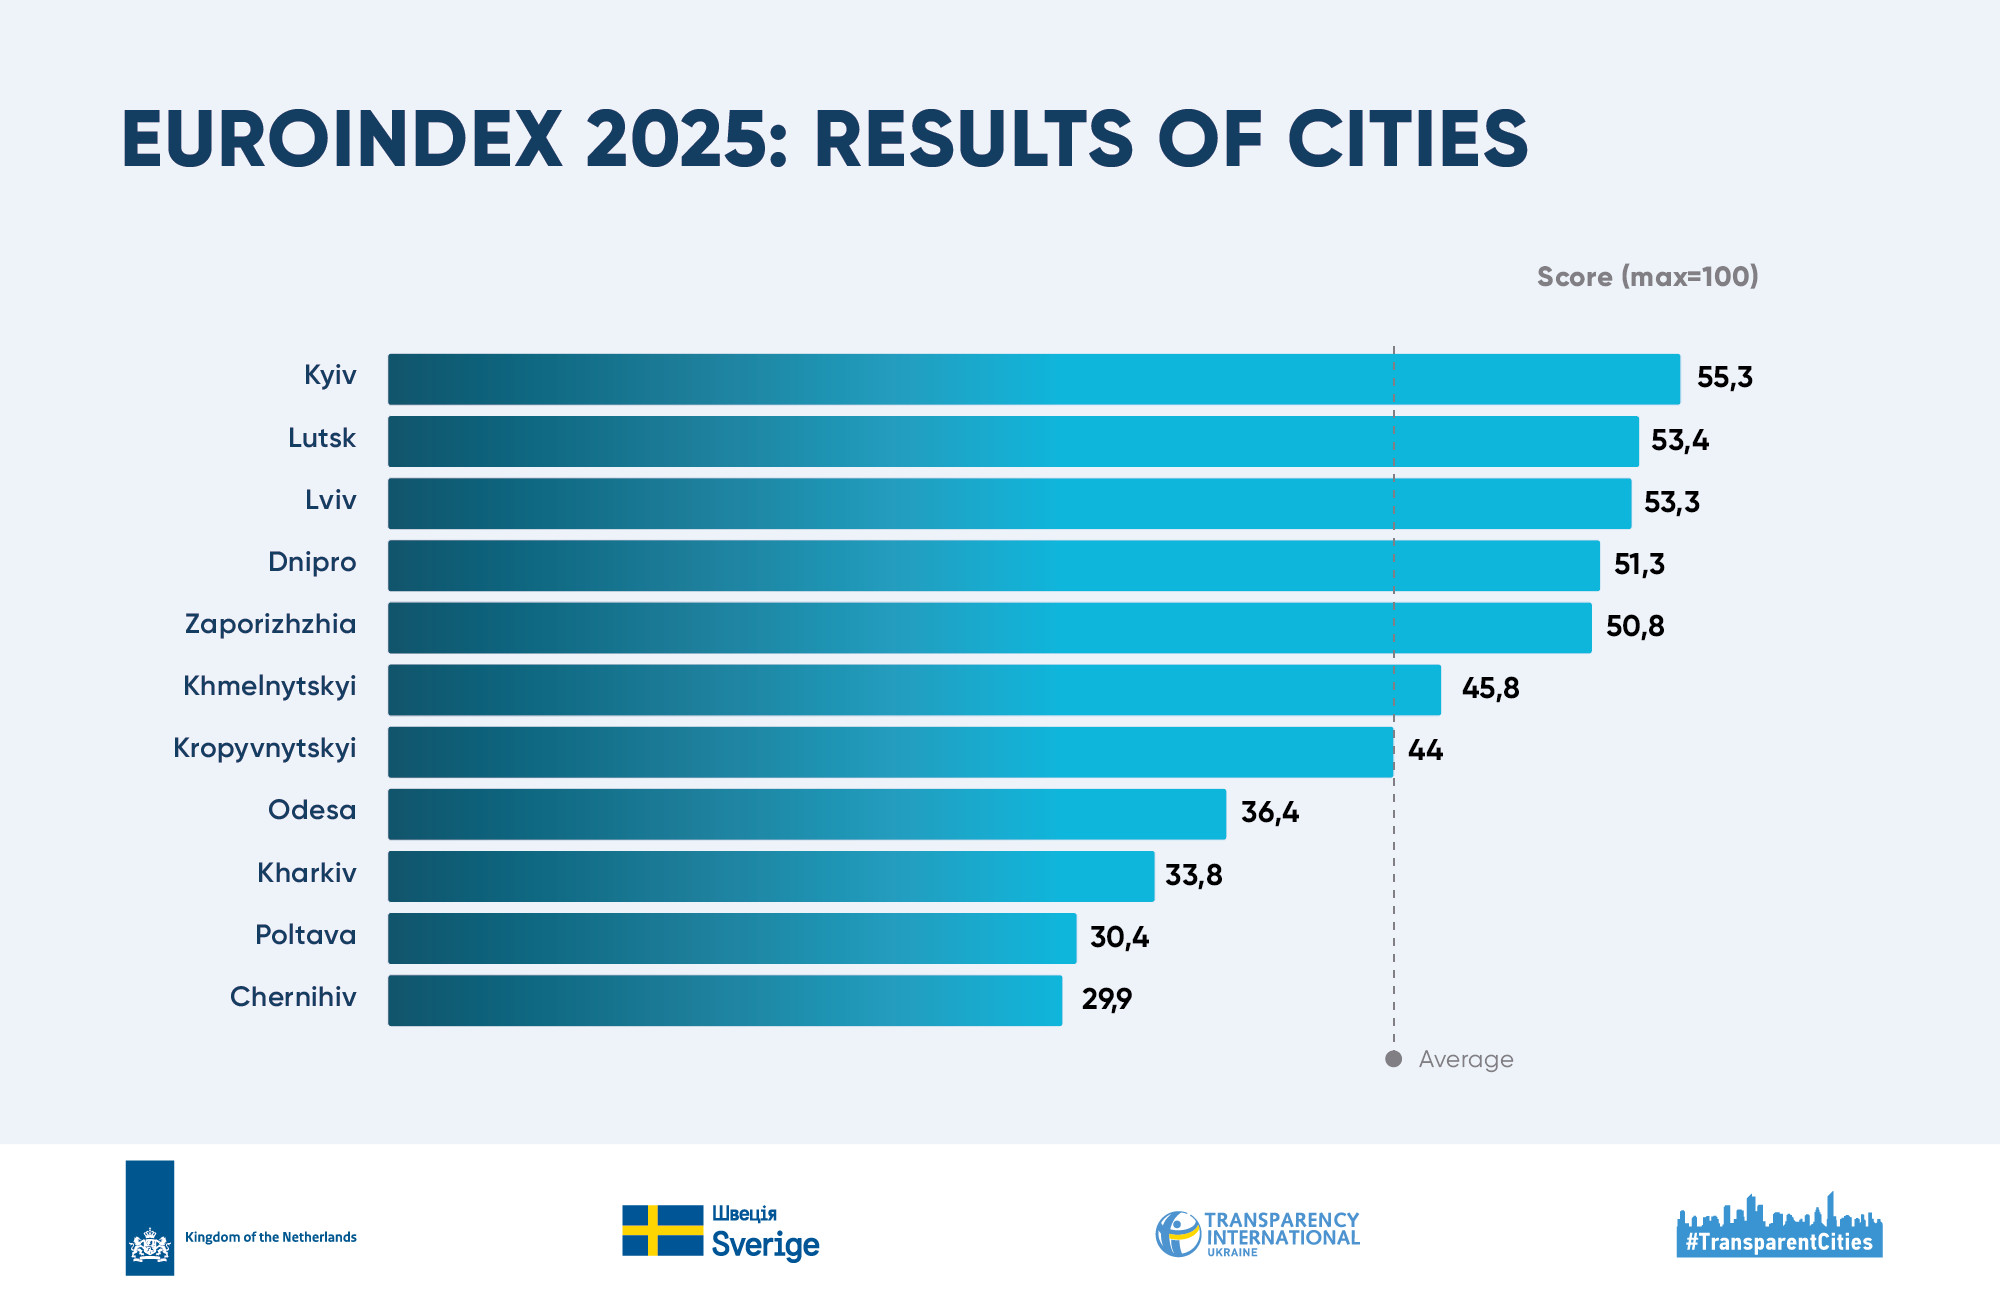
- The average Euroindex score across the 11 pilot cities was 44 out of 100.
- Kyiv and Lutsk topped the Euroindex based on their 2025 performance. The capital performed best in the E-services and Open Data subindices, while Lutsk led in the Integrity and Anti-Corruption and Accountability blocks. Both cities showed a European approach to user-centricity. On their city councils' official websites, analysts found 93% (Kyiv) and 80% (Lutsk) of the single points of entry to thematic sections they looked for. However, even the leaders' scores (55.3 and 53.4 out of 100) show that Ukrainian city councils are not yet well prepared to meet EU integration requirements for transparent democratic governance.
- Chernihiv and Poltava performed worst. Poltava ranked in the bottom three in five of the six subindices, and only a high score in the Accountability block kept it from finishing last overall. In Chernihiv, every component of the Euroindex proved problematic: the city scored below 50 points in all blocks.
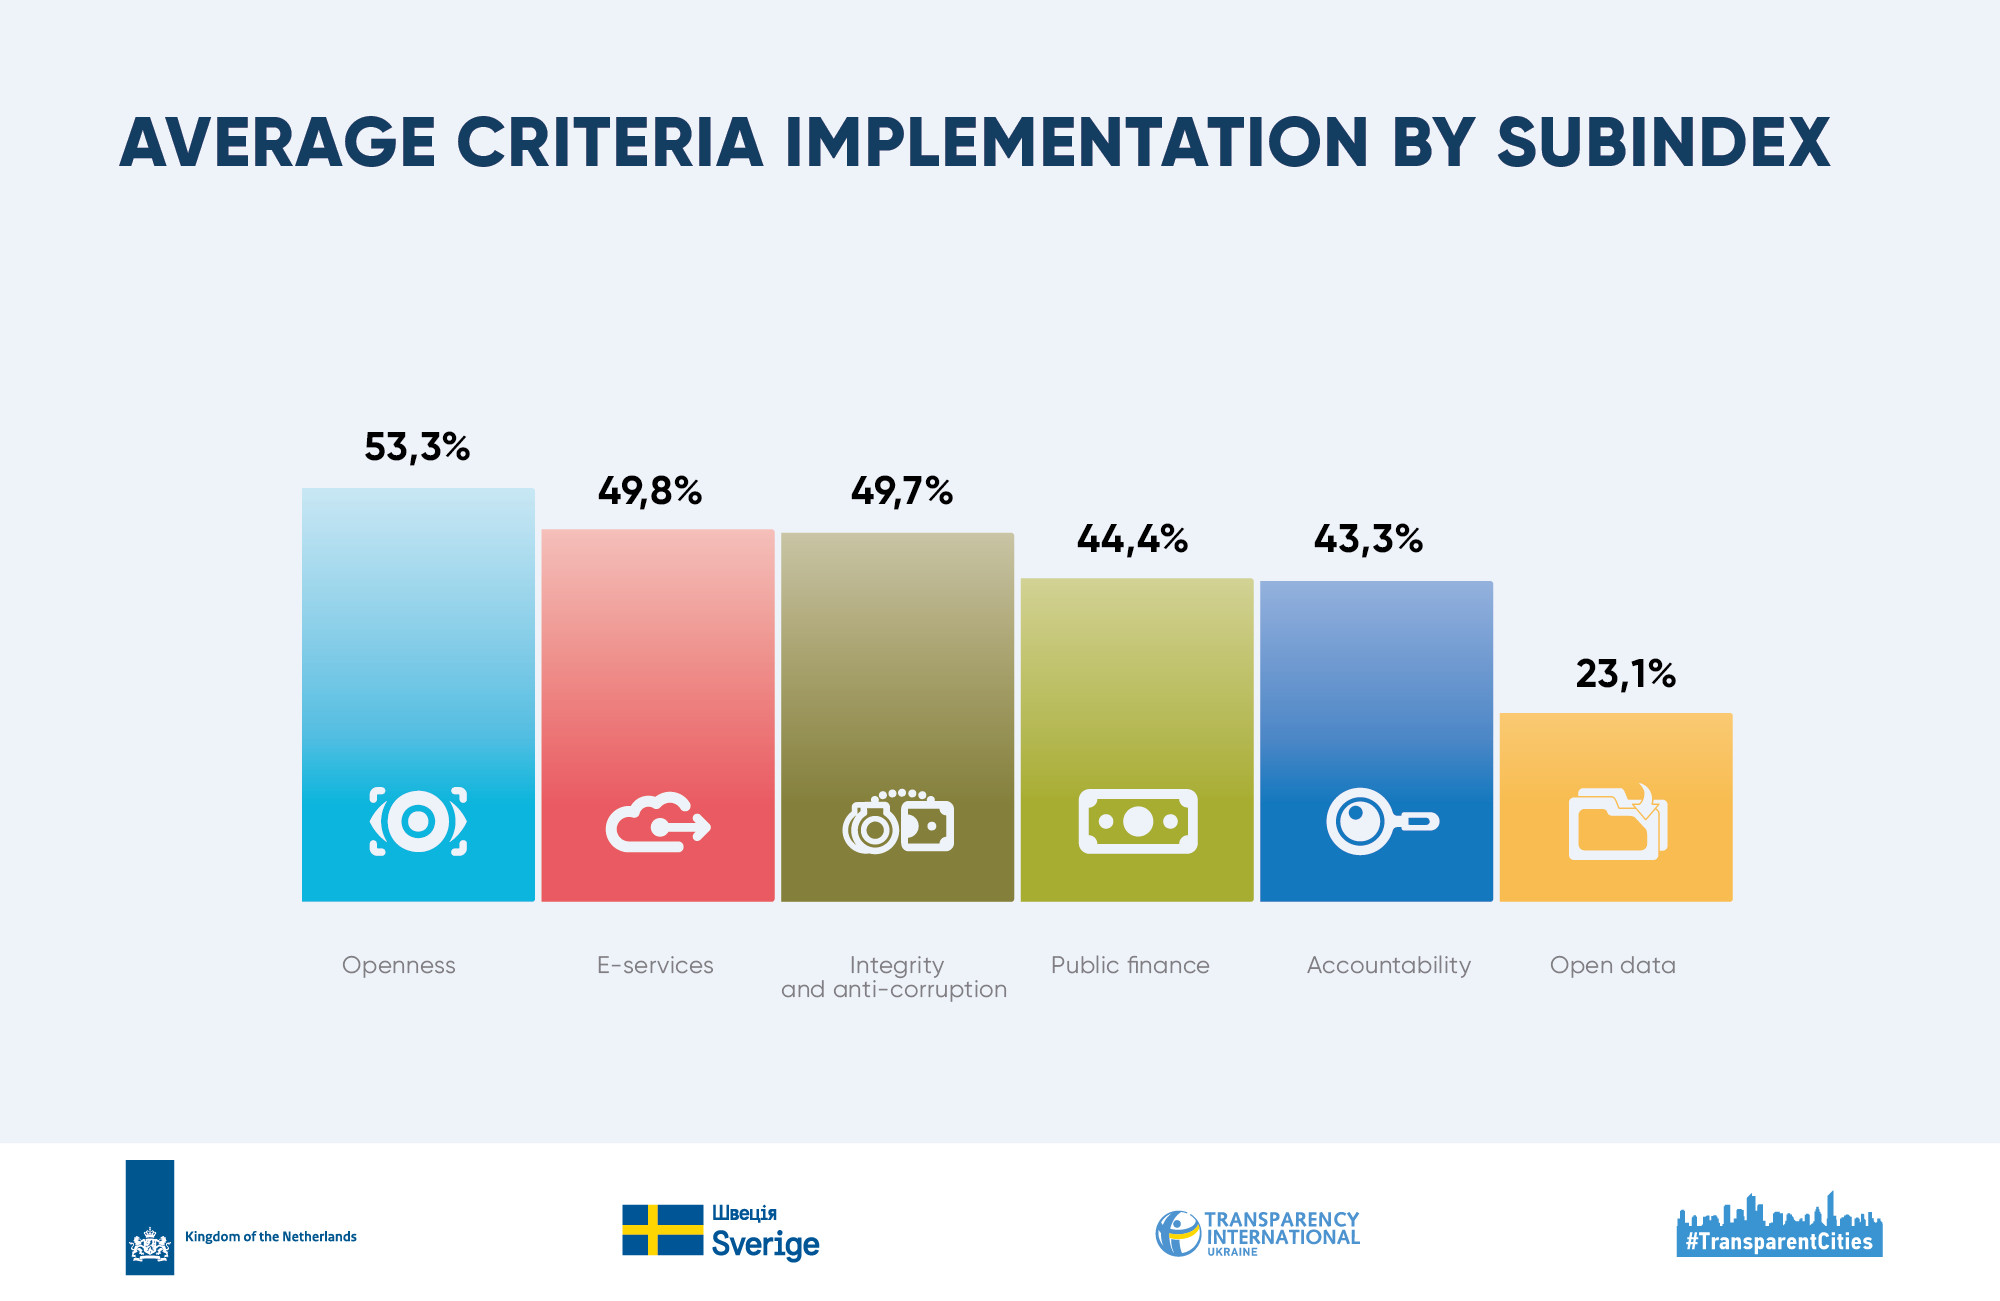
- The 11 pilot city councils did best on the Openness and E-services subindices, with average implementation levels of 53.5% and 49.8%. They did worst on the Open Data block, at 23.1%.
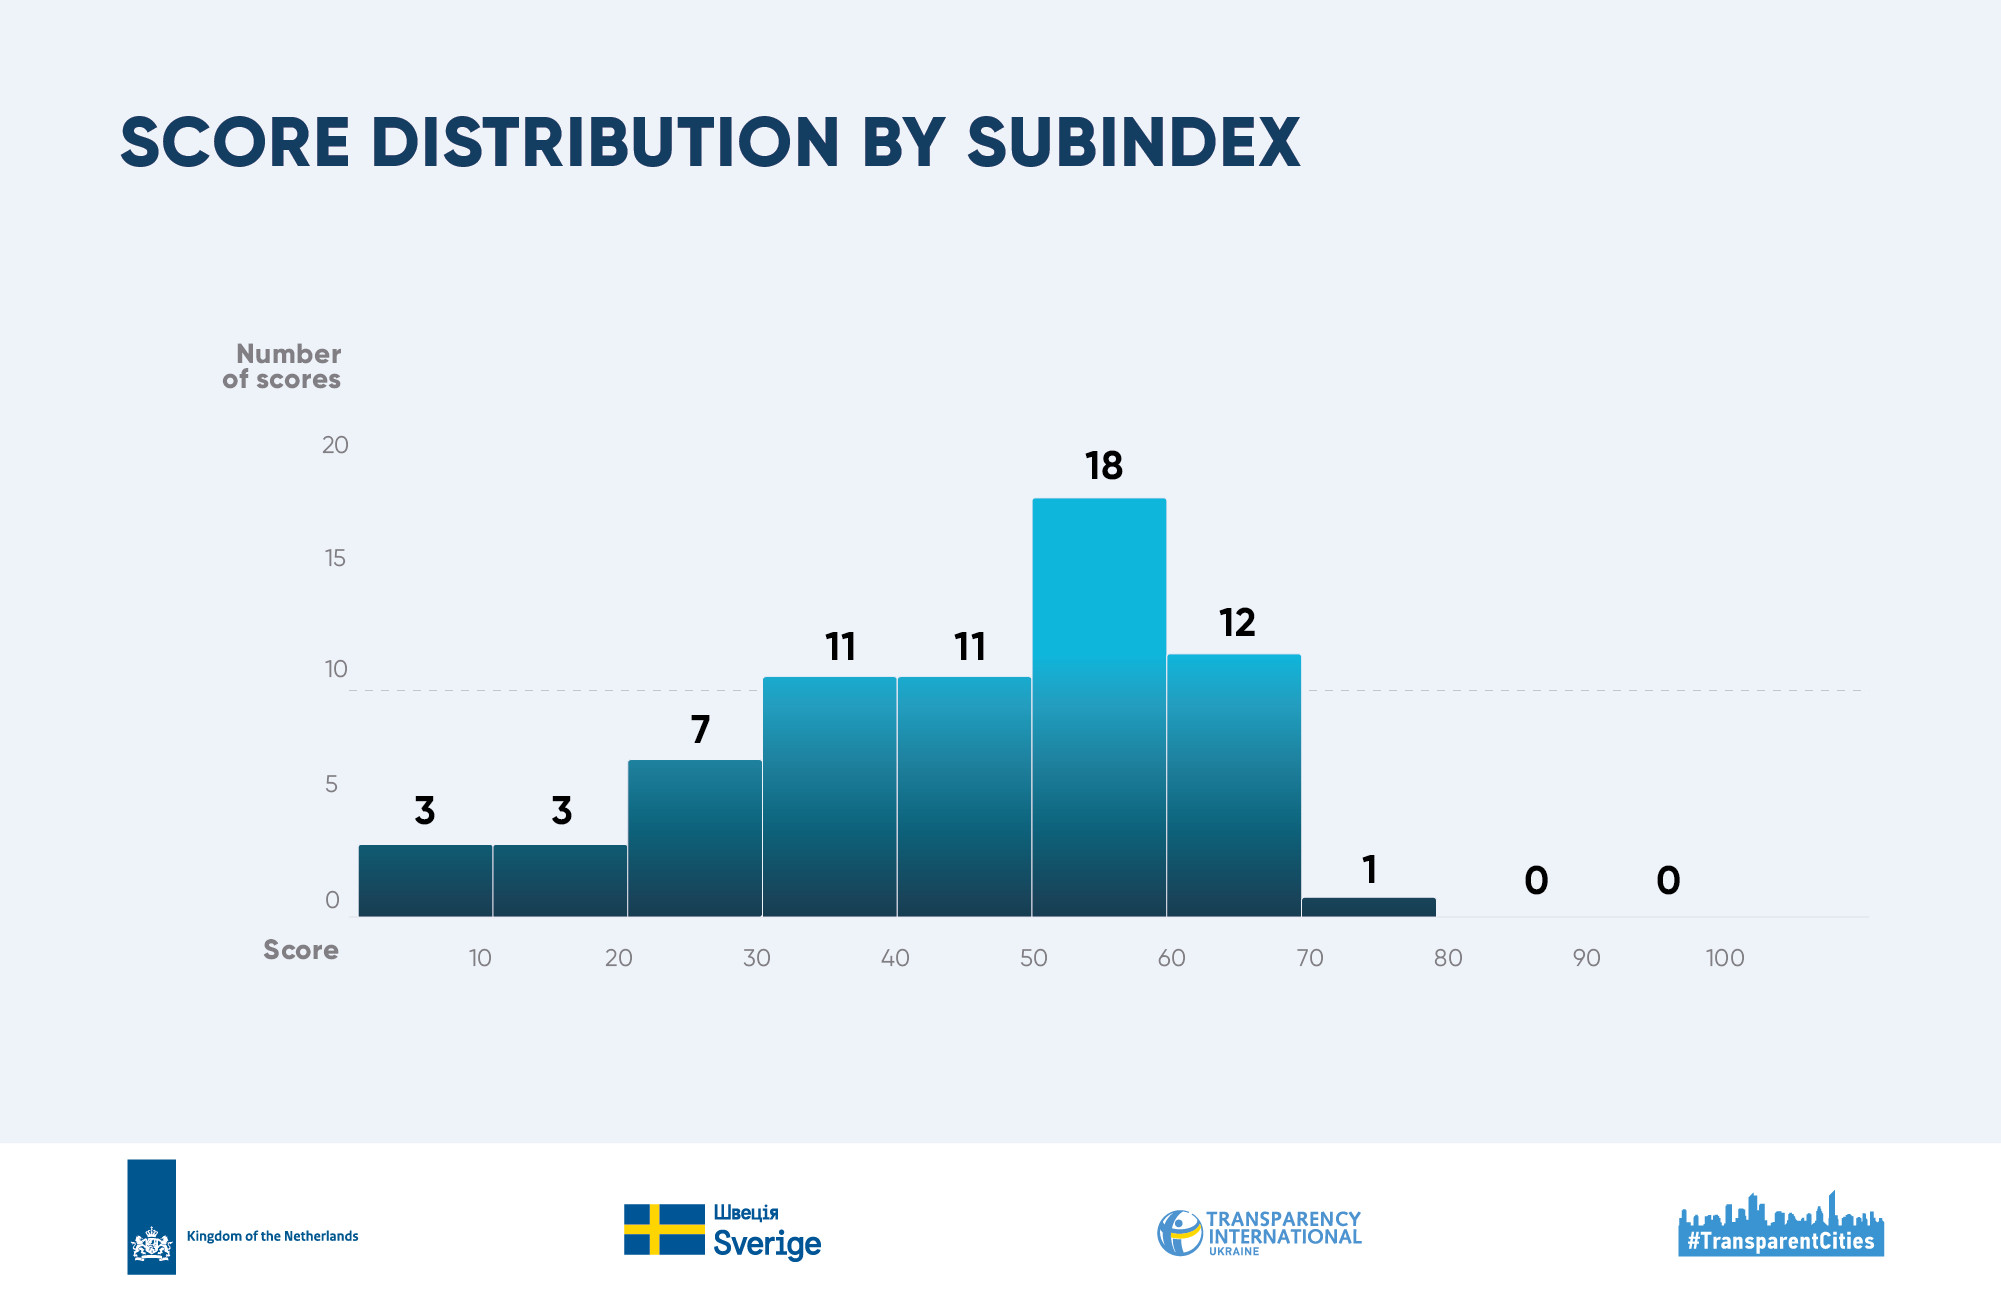
- In 79% of cases, city scores for individual subindices fell between 30 and 69 out of 100. Most scores were middling rather than very low or very high. The largest group of scores, 18 of 66 (27%), fell in the 50–59 range.
- The top result, 70 points in a single subindex, was achieved only once: by Kyiv in E-services.
- Five cities scored below 20 out of 100 in the Open Data subindex: Odesa, Poltava, Kharkiv, Khmelnytskyi, and Chernihiv. Kharkiv also scored below 20 in the Accountability block.
- City council results were most consistent in the Openness subindex, where the highest and lowest scores differed by 28 points. They were most uneven in the Accountability block, with a 54-point range.
- Three cities shared the lead across the six subindices. Dnipro led Openness and Public finance. Kyiv led E-services and Open Data. Lutsk led Integrity and Anti-Corruption and Accountability.
- Nearly every pilot city made the top three in at least one subindex. Lutsk (two first places, two second) and Kyiv (two first places, two third) made it most often. Lviv made the top three three times. Chernihiv was the only city that never did.
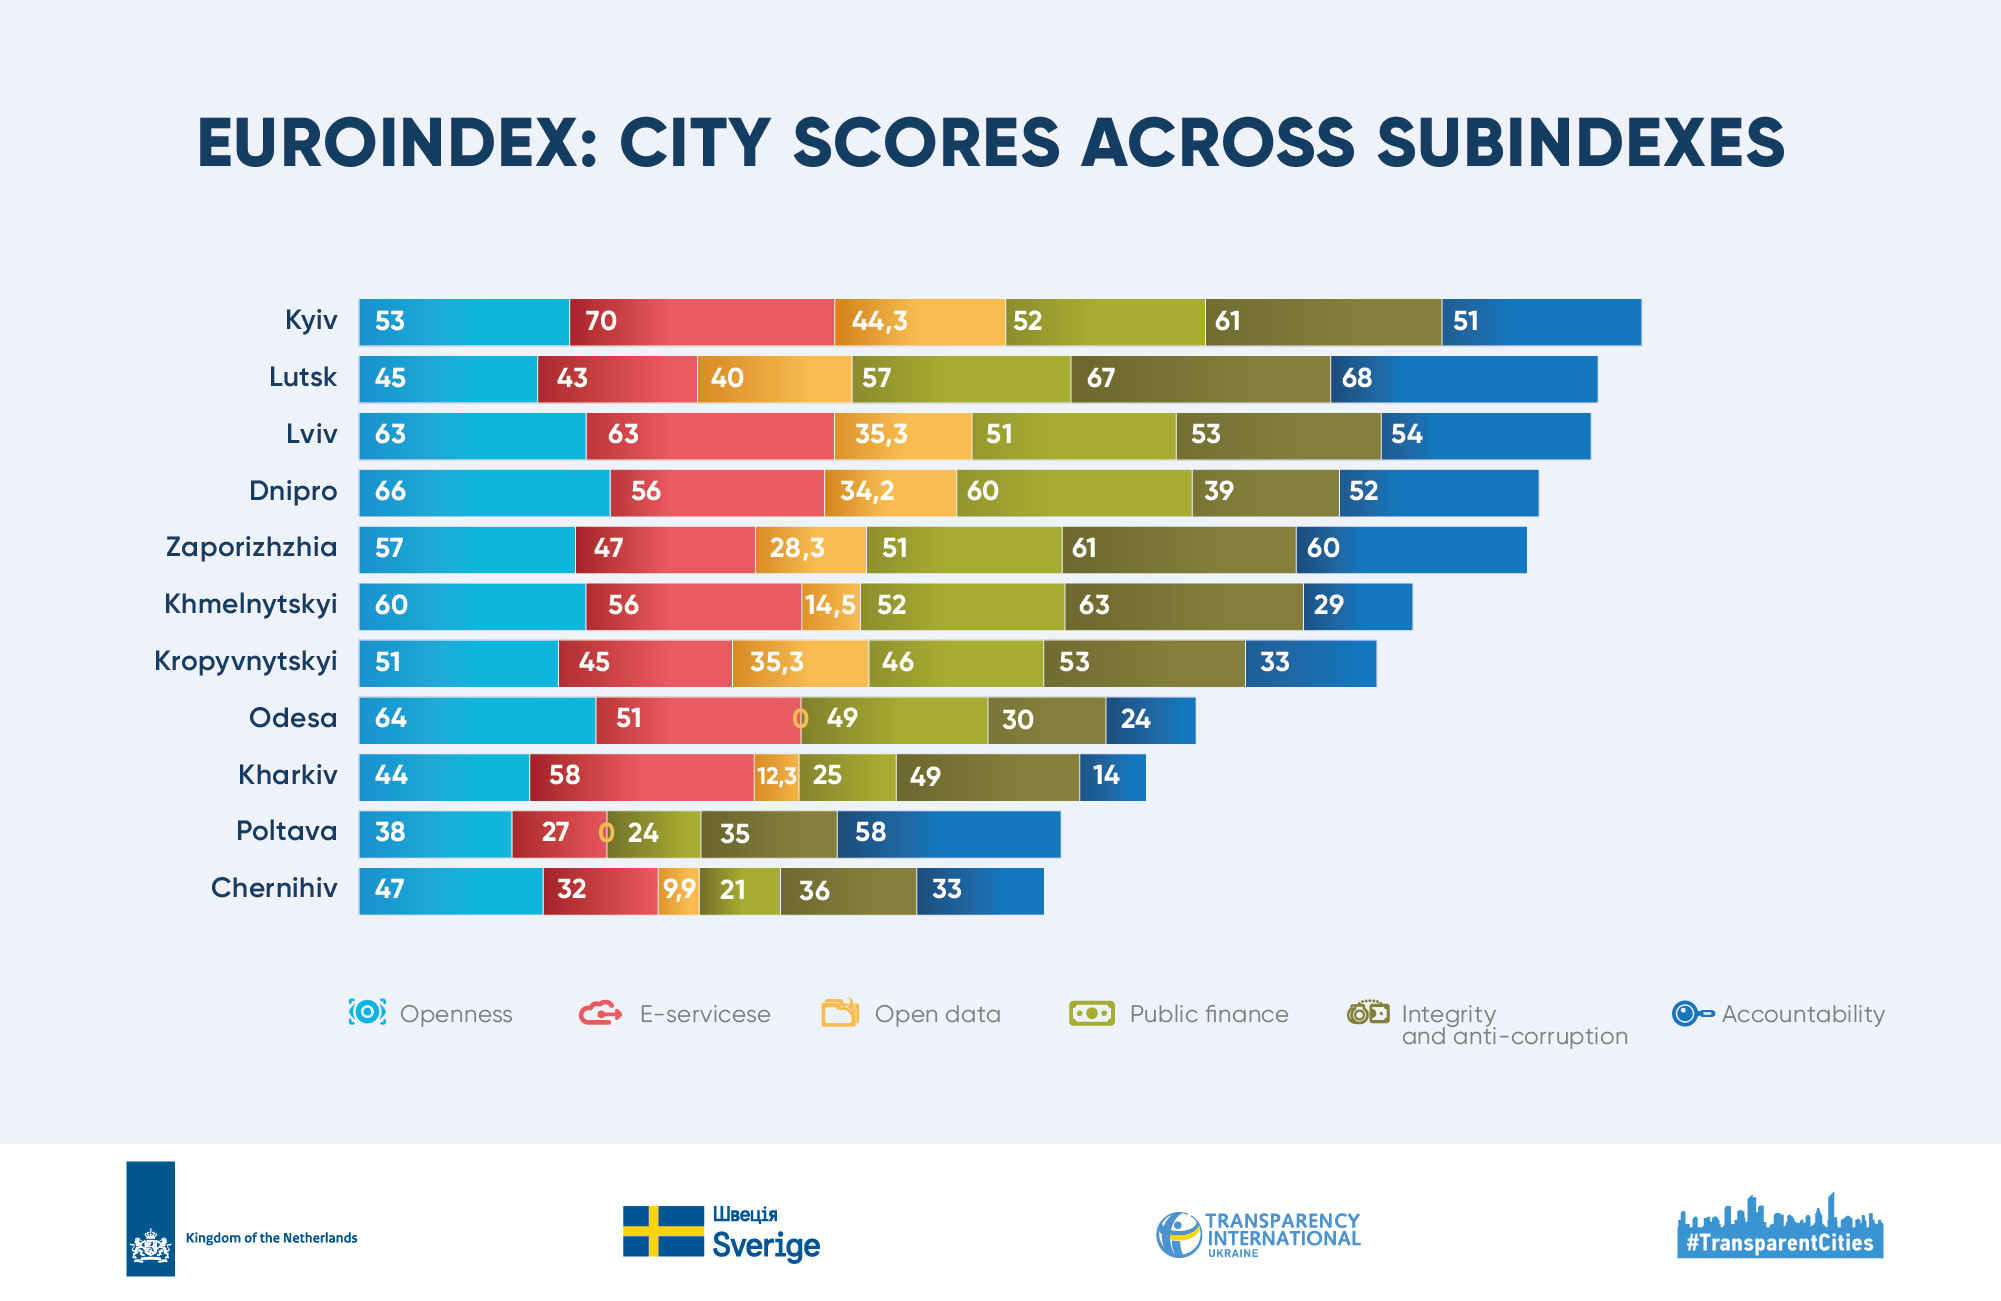
- Kropyvnytskyi was the most consistent performer across the six subindices, with 20 points between its highest and lowest scores.
- Odesa and Poltava showed the sharpest contrasts, with score ranges of 64 and 58 points. This points to well-developed areas alongside neglected ones.
- The Euroindex covered three regional centers designated as territories of potential hostilities: Zaporizhzhia, Odesa, and Kharkiv. In several blocks, these municipalities competed well with their counterparts in rear areas: Zaporizhzhia placed second in Accountability and third in Integrity and Anti-Corruption. Odesa placed second in Openness. Kharkiv placed third in E-services. However, some blocks revealed serious problem areas in these frontline city councils. In Odesa, these were Open Data, Integrity and Anti-Corruption, and Accountability. In Kharkiv, they were Openness, Public Finance, and Accountability.
- The three frontline cities averaged 40.3 out of 100 on the Euroindex, against an overall average of 44.
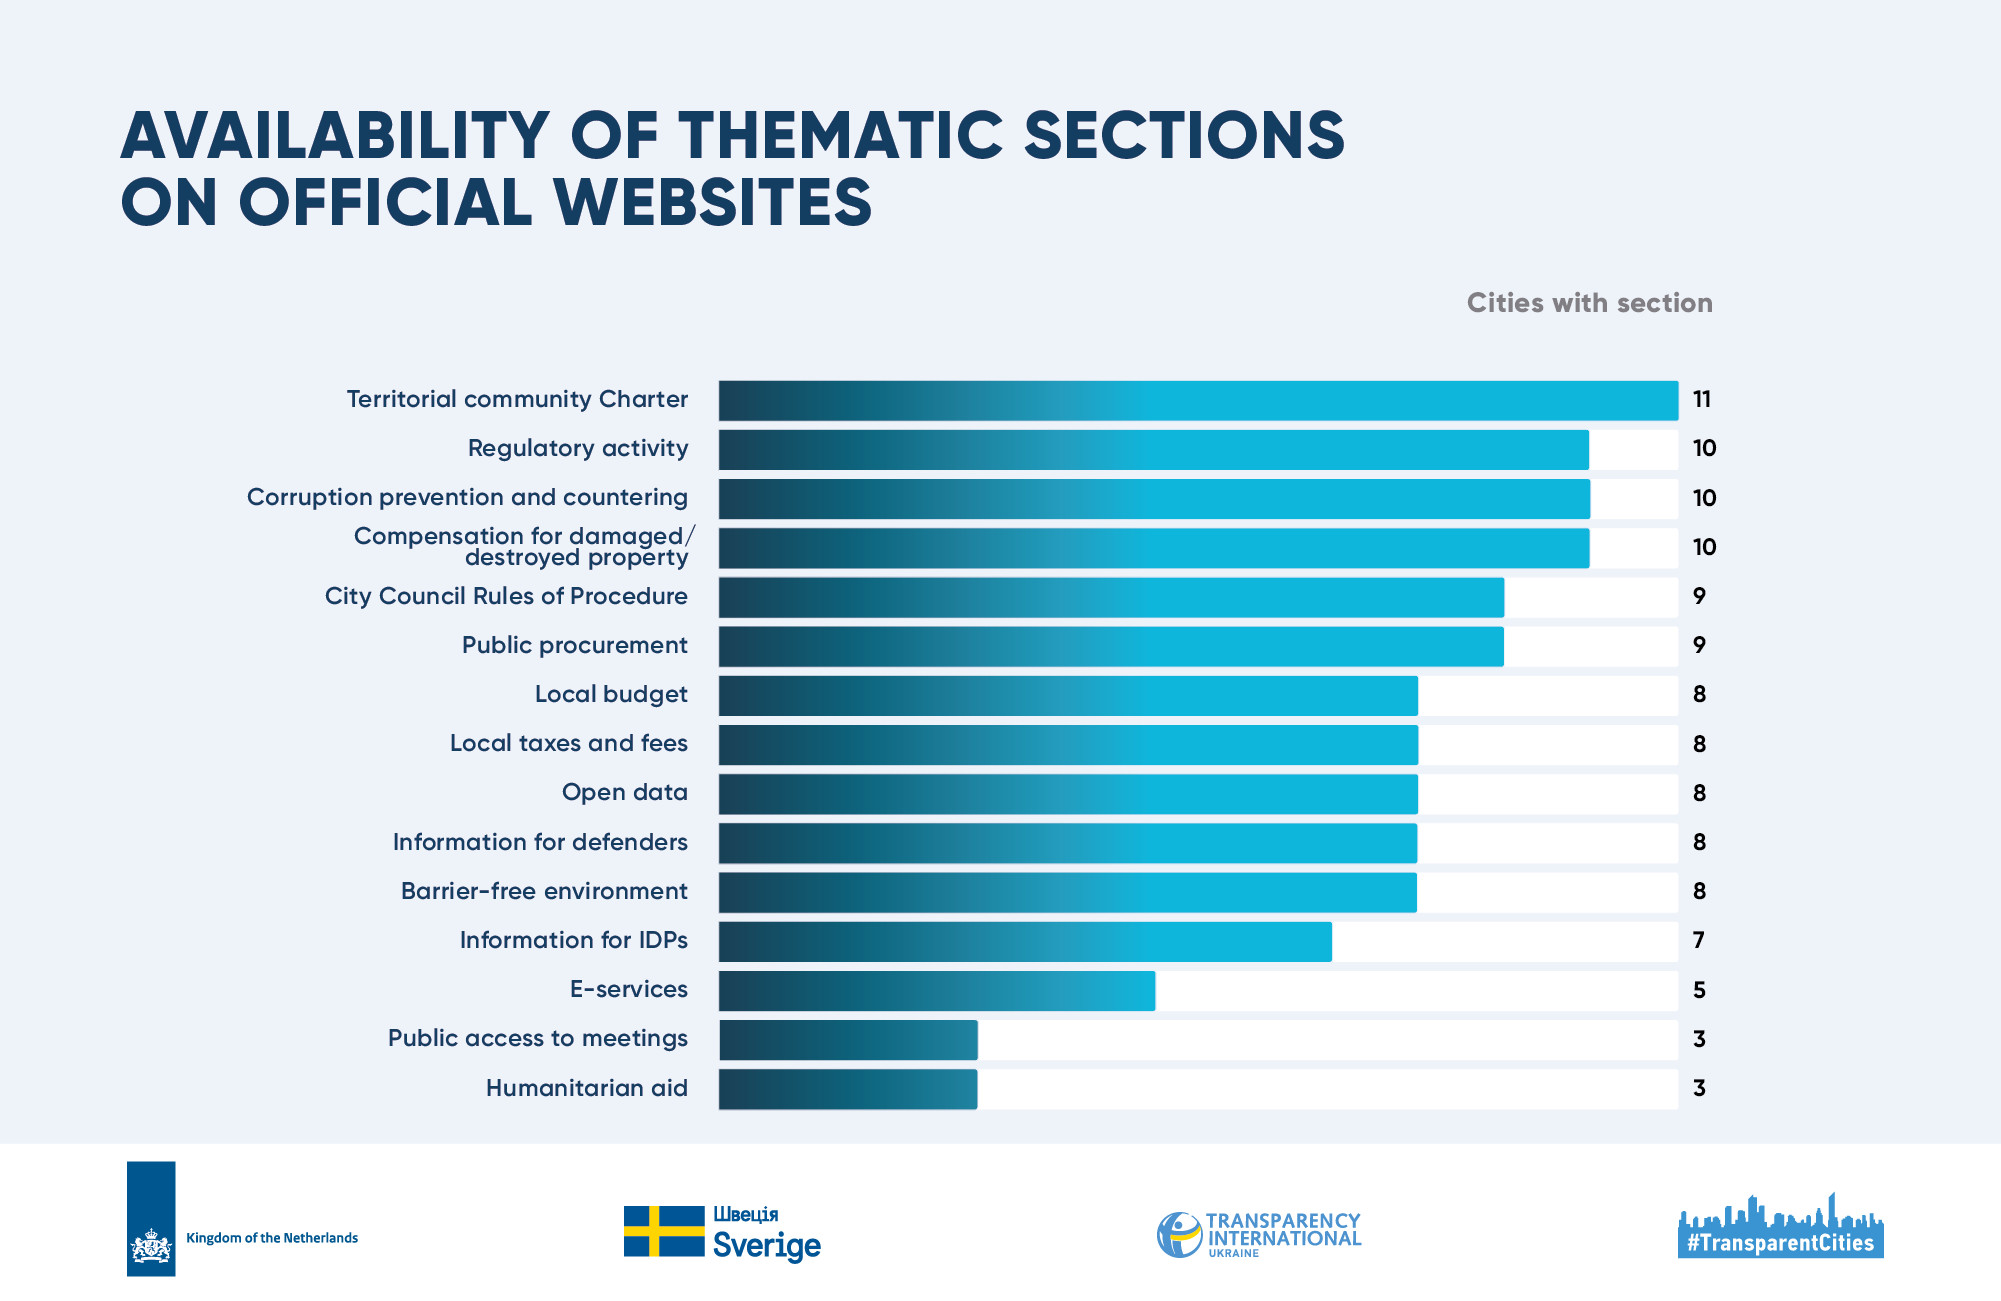
- Analysts checked compliance with the “single point of entry” principle on official council websites. The relevant thematic sections or pages were in place in 71% of cases in 2025.
- At the time of review, all 11 city councils had a dedicated page on the Charter of the territorial community. The Charter is the core document that enshrines the rules of local democracy, transparency, and accountability, along with decision-making procedures and engagement with residents. Ten of the 11 councils had thematic sections on three topics: regulatory activity, corruption prevention and counteraction, and compensation for real estate damaged or destroyed during the war.
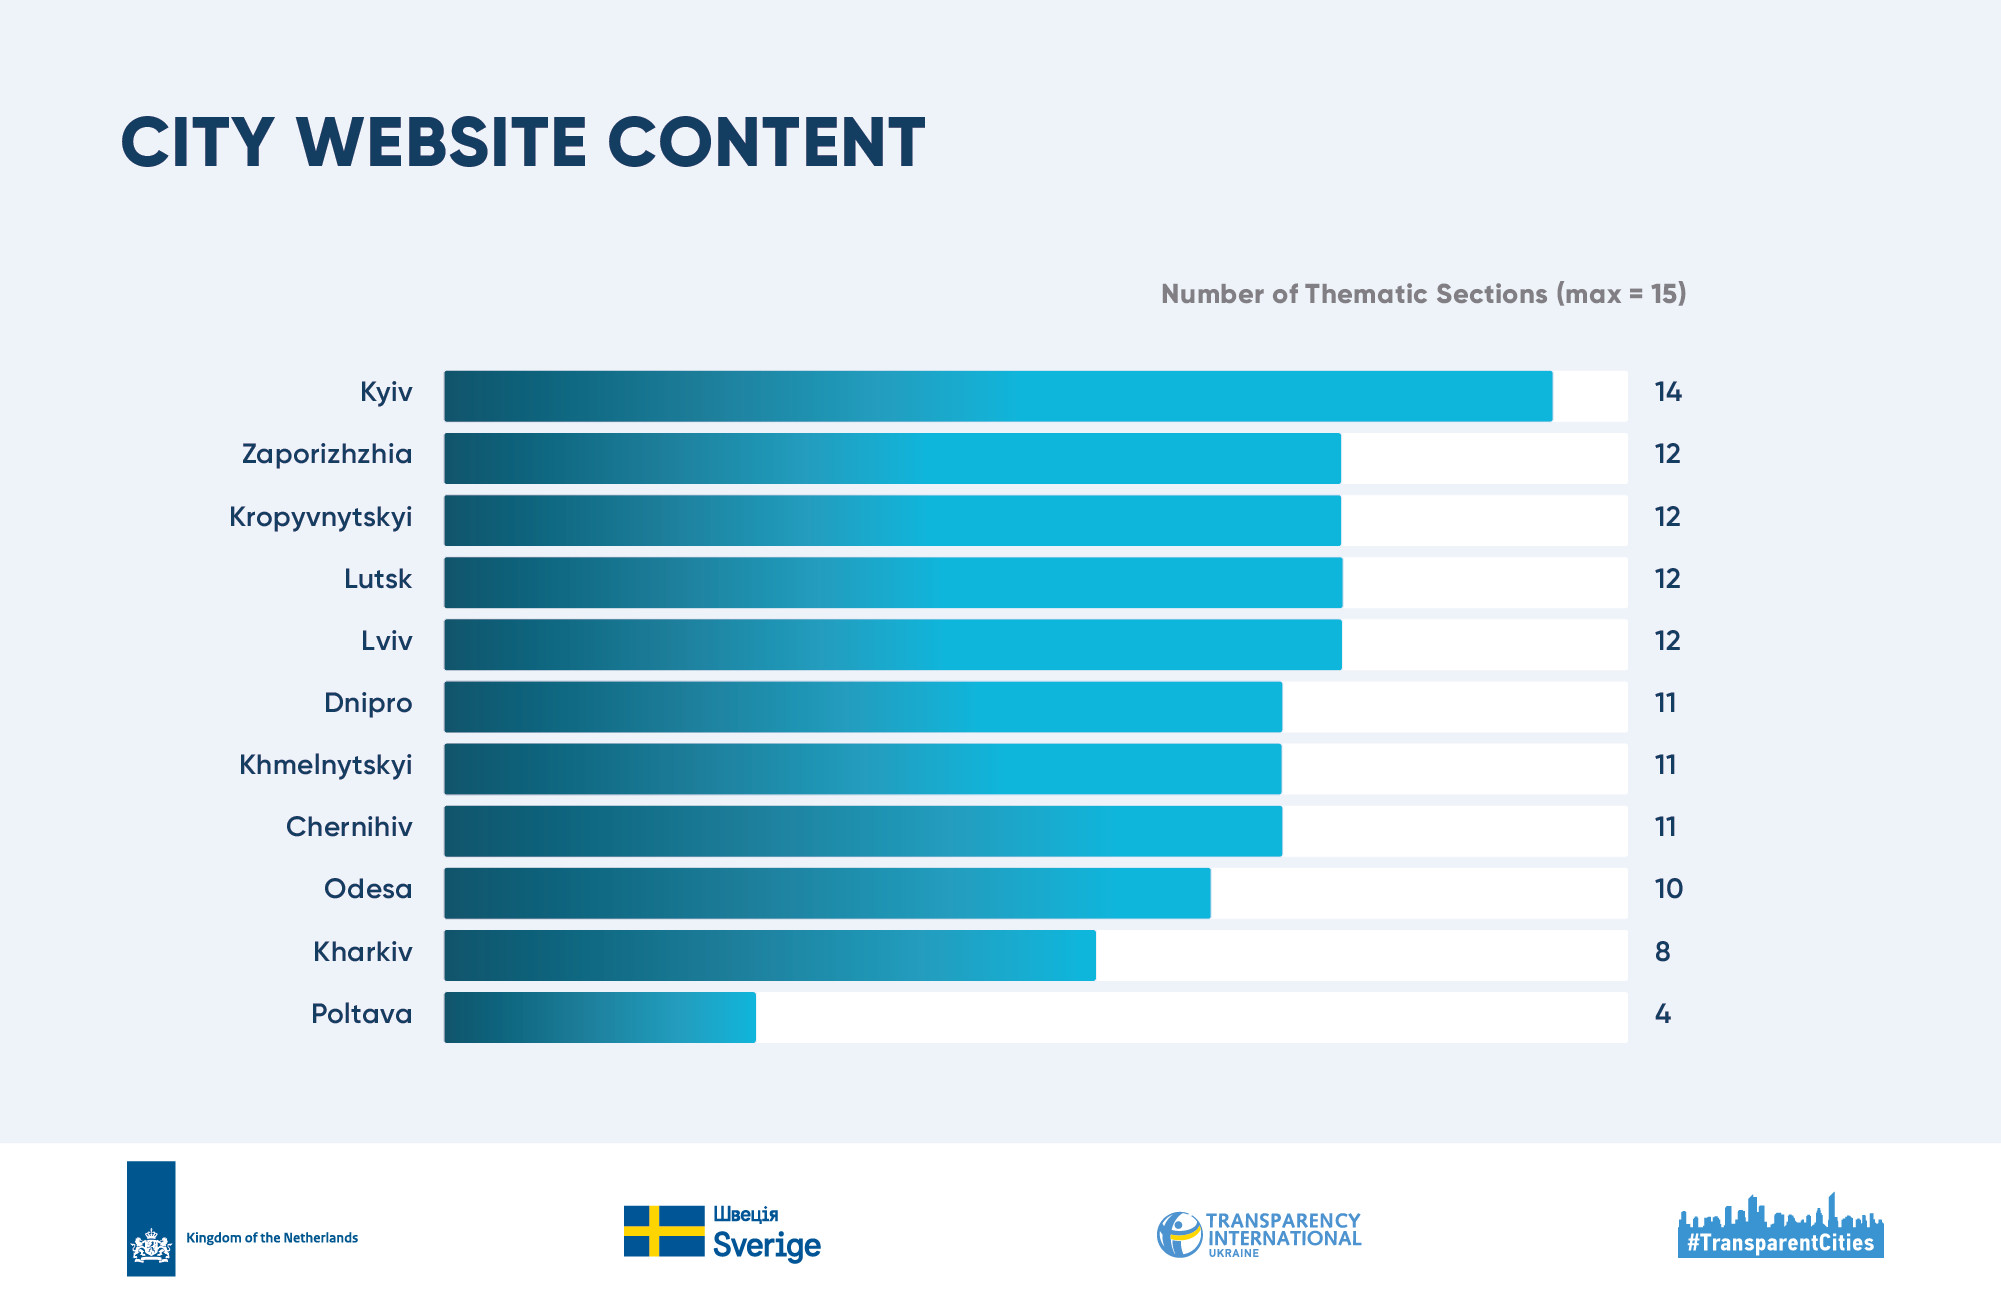
- Kyiv showed genuine user-centricity. Experts found 14 of the 15 thematic sections on its websites, each collecting, structuring, and continuously updating all reference information on its topic. The only section missing at the time of review was the one on e-services. Information had not been properly compiled for the very area where Kyiv scored its best result: 70 points.
- The official website of Poltava City Council was the most poorly structured at the time of review. It had only 4 of the 15 thematic sections analysts looked for. Residents lacked convenient access even to basics that any city council website is expected to have: consolidated information on the local budget and on regulatory activity.
- Of the 240 indicators assessed, only 15 (6%) were met by all 11 city councils. These include:
- publishing city council decisions, executive committee decisions, and mayoral orders on the official website;
- broadcasting council meetings, or publishing video recordings promptly and no later than the day after the meeting;
- providing e-services for real-time tracking of municipal transport, online enrollment of children in municipal preschools, and local e-petitions;
- using Prozorro.Sale to hold auctions for leasing municipal property;
- setting up the hierarchy of contracting authorities subordinate to the city council in the BI Prozorro public analytics module;
- timely submission by the city council's top officials of their annual asset declarations for 2025.
- Thirteen indicators (5%) were met by none of the 11 municipalities. They include indicators checking:
- aggregated statistics on decisions to grant compensation for damaged or destroyed real estate;
- publication of the Procedure for receiving and distributing humanitarian aid and a list of humanitarian aid recipients (the council's executive bodies, municipal enterprises, and institutions);
- step-by-step instructions for residents on how to access remote council meetings;
- a published list of public proposals on the draft local budget for 2026;
- a published list of social services that residents can order online;
- a list of council members held liable for corruption or corruption-related offenses in 2025;
- publication of the mayor's written report on their work in 2025 seven calendar days before the open meeting with the community.
- Throughout 2025, only three of the 11 Euroindex participants had a current territorial community development strategy: Kyiv, Kropyvnytskyi, and Lutsk. None of them had published a 2025 monitoring report on implementing the strategy as of the July 2026 review.
Khmelnytskyi followed its strategic development plan for the territorial community for 2021–2025 and published information on progress under that plan for the whole period. This made it the only city credited with the indicator on having a 2025 monitoring report.
- Kyiv led in publishing city programs and reports on their implementation. For 2025, the capital published four types of the program documents analysts looked for: the social and economic development program; the informatization program; two anti-corruption programs, one for the Kyiv City Council and one for the Kyiv City Military Administration; the action plan for implementing the National Strategy for Creating a Barrier-Free Space. Kyiv published implementation reports for all of these in the appropriate thematic sections of its websites. The one exception was the report on the Kyiv City Council's anti-corruption program.
- Chernihiv did worst at publishing program documents and implementation reports. Experts found only one document in the appropriate place: the 2025 report on implementing the action plan for the National Strategy for Creating a Barrier-Free Space. Tellingly, the barrier-free thematic section had no link to the action plan itself.
- The 11 cities did best at publishing the 2025 social and economic development program and its implementation report. Ten of the 11 city councils published the program, and eight published the report.
- The widest gap between having a program and reporting on it was for the informatization program. Eight municipalities had a current program in 2025, but only three published the corresponding reports: Zaporizhzhia, Kyiv, and Kropyvnytskyi.
- The mayors of only 4 of the 11 cities reported on their 2025 work at an open meeting with the community: Dnipro, Zaporizhzhia, Lviv, and Poltava.
Key findings of the study
Some European practices are already part of how Ukraine's city councils operate, but much work remains. The 11 pilot cities averaged 44 out of 100 on the Euroindex, and individual scores ranged from 29.9 to 55.3.
City councils have implemented basic openness to a high standard. In 2025, all or nearly all municipalities published decisions of the council and executive committee and mayoral orders, posted videos of sessions and standing committee meetings, and provided access to the Charter of the territorial community, the Rules of Procedure of the city council, current legal regulations, and regulatory activity plans.
Formal compliance prevailed over substance. A few examples: the Open Data block showed that publishing datasets does not ensure their quality; the Openness block, that setting up commissions to review compensation for damaged property does not guarantee that data on their decisions are made public; the Public finance block, that holding budget hearings does not mean residents' proposals are compiled and shared; and the Integrity block, that having anti-corruption officers in place does not guarantee publication of monitoring data on the current anti-corruption situation.
The gap between cities in 2025 was significant in every subindex. The smallest spread of results was in the Openness block (28 points), and the largest in the Accountability block (54 points). This reflects differing challenges, priorities, and approaches among municipalities. It also shows there is no single model of transparent democratic governance for city councils to follow on their EU integration path.
No city council led across all areas examined. Ten of the 11 municipalities made the top three in at least one subindex. This reveals a lack of consistency in each council's governance practices. Successes are fragmented and tied to specific areas rather than to the municipality's institutional culture as a whole.
The war had an impact but was not the decisive factor in adopting European governance practices. The average Euroindex score of the three frontline cities was only five points lower than that of the eight cities not located in territories of potential hostilities. Zaporizhzhia was among the leaders in Accountability and in Integrity and Anti-Corruption, Odesa in Openness, and Kharkiv in E-services. Achieving this level, however, takes far greater effort in these cities. There, local government resources go mainly to keeping critical services running, dealing with the aftermath of enemy attacks, helping affected residents, and maintaining critical infrastructure and civil protection facilities.
City councils show readiness to solve local problems with new technologies. Real-time tracking of municipal transport and cashless fare payment, online kindergarten enrollment with remote queue tracking, round-the-clock intake of citizen appeals through an electronic contact center, e-petition services, and online booking at Administrative Service Centers have become everyday practice in nearly all pilot cities.
Strategic planning remained a serious challenge for communities, despite a long history of planning in various areas. The Ministry for Communities and Territories Development approved methodological guidelines on developing, approving, implementing, monitoring, and evaluating territorial community development strategies back in 2022. Yet as of 2025, only 3 of the 11 Euroindex participants had adopted a current territorial community development strategy — the document meant to carry European standards into local self-government practice and to keep reforms on track regardless of staff changes, political cycles, or external challenges.
The management cycle “plan → implementation → report → feedback → adjustment” often broke down as early as the third stage. For example, the 10 social and economic development programs had only 8 published reports, and the 8 informatization programs had just three. This significantly limited the chance to get public feedback and adjust governance approaches.
Feedback between city councils and communities proved one of the weakest links across all subindices. Difficulties arose both in designing the relevant procedures and in following them. For example, a dedicated page on the official website explaining how to attend council sessions is a prerequisite for a simple path from a citizen's wish to attend a meeting to actually doing so. In 2025, only 3 of 11 city councils had one. Another example: the mayor must report to the territorial community at least twice a year at an open meeting that allows residents to ask questions, comment, and make proposals, with the text of the report published a week before the event. Only 4 of 11 mayors reported on their work at an open meeting in 2025. No city published the text of the report within the statutory deadline.
Resident engagement in decision-making — the foundation of democracy — was often merely declarative. No city published a list of public proposals on the draft 2026 budget in a dedicated budget section, and 10 of 11 cities did not publish minutes of public hearings on the draft budget or the results of consultations with business on procurement.
Only Kyiv applied the “single point of entry” principle systematically to topics on the official city council website. This user-centric European approach has not yet become an across-the-board management practice: it depends on the specific unit or topic rather than on a consistent approach to organizing information on websites.
Responsibility for the gaps does not rest solely with local self-government bodies. The low implementation of Open Data indicators stems not only from insufficient attention from city councils but also from external factors. Since 2022, the datasets of Zaporizhzhia and Kharkiv have been removed from public access by the state, and access has still not been restored — even for datasets whose publication poses no threat to national security, territorial integrity, or public order. In addition, the Ministry of Digital Transformation of Ukraine has not set up monthly automated transfer of data from the local open data portals of Dnipro, Kropyvnytskyi, Lutsk, and Lviv to the Unified State Open Data Web Portal.
Testing the findings on a wider sample of cities
Work on each subindex of the 2025 European City Index followed the same sequence: developing and testing the methodology; assessing indicators using a standard form; compiling and processing the dataset; writing an analytical brief; presenting and/or publishing the brief and communicating the results.
After each subindex's results were published, analysts retested some of its indicators on a wider sample of either 20 regional* or 50 largest* Ukrainian cities. The results of these extended checks appeared as separate materials on the Transparent Cities website (see the list here).
The additional reviews confirmed the main study's findings, including the following:
- Transparency in the distribution of humanitarian aid remains a weak spot for most municipalities. Only 3 of 50 cities published the full required information (list of recipients, distribution criteria, reporting) in a thematic section on humanitarian aid: Mykolaiv, Chernivtsi, and Shostka. City councils' coverage of this issue still falls short of what a full-scale war demands.
- The “single point of entry” principle is applied selectively. Only 18 of 50 city councils had a website section or a separate dedicated resource with correct links to at least seven current e-services. Of the 19 regional centers, only nine designed their websites around residents' needs.
Cities did somewhat better with open data thematic sections, which 39 of them have on their official websites. These sections regularly include regulations and links to the council's account on the state portal. However, only 5 city councils added links to actual services built on this data.
- The quality of municipal open data is low. For example, only 1 of 50 cities, Kyiv, created a dataset on utility tariffs in line with the Ministry of Digital Transformation's recommendations and published it on time on the Unified State Open Data Web Portal. As a result, journalists, researchers, and e-service developers cannot combine local government data from data.gov.ua at either the regional or the national level.
- Feedback from residents is not treated as an essential part of deciding important issues. Only 13 of 20 regional centers involved residents in adopting the 2026 budget. Only 10 did so through budget hearings, as the law requires.
- There are significant gaps even in municipalities' formal accountability. Analysts found 41 of 50 annual activity reports by corruption prevention and detection officers on the Integrity Portal. Only 34 of these electronic forms were completed on time, by February 10, 2026.
Several sources indicate that the study's findings apply to a much wider range of Ukrainian cities: the additional reviews, the self-assessment forms, the reach of the materials on the website, and feedback from cities. The program therefore encourages local government representatives to use the tools it has developed.
Impact of the European City Index on cities
Data collection for the European City Index ran from September 2025 to July 2026. Roughly every two months, program experts published findings on one thematic area, developed recommendations, and gave the pilot cities roadmaps for improving the relevant practices. After publication, the team continued to advise city councils and track changes.
More than half of the pilot cities gave feedback on the program's recommendations and continued to work with the program. At meetings with Kyiv, Poltava, and Khmelnytskyi, the cities presented their own work and program experts recommended improvements. Zaporizhzhia, Lutsk, and Dnipro also reported changes made in line with the roadmaps they received.
Follow-up monitoring recorded improvements in all three areas that were reviewed again:
- Openness (initial data collection: September 2025; follow-up: September 2026). The average indicator implementation level rose from 53.5% to 72.4%. City councils created about 10 new “single points of entry.” Poltava, Zaporizhzhia, and Khmelnytskyi made the greatest progress. Kharkiv was the only city with no significant changes.
The most notable progress was in publishing aggregated statistics on compensation for damaged and destroyed real estate. In September 2025, no city met this indicator. By fall 2026, seven city councils had added the required information to their eRestoration thematic sections.
Public access to city council meetings and transparency of humanitarian aid remain the hardest issues for cities. Even at follow-up, implementation of these criteria remained low.
- E-services (initial data collection: October 2025; follow-up: July 2026). The average implementation level rose from 49.8% to 57.4%. Kyiv, Lviv, and Poltava created new e-services thematic sections that they had lacked at the first assessment. Dnipro, Poltava, and Khmelnytskyi made the greatest progress. Odesa, Kharkiv, and Chernihiv showed no significant changes.
Gains on individual indicators remain moderate. The most problematic areas are still electronic social and medical services and comprehensive city mobile apps. Improving these requires considerable effort, including building or upgrading the digital services themselves.
- Public finance (initial data collection: March 2026; follow-up: September 2026). The average implementation level for indicators on publishing key budget and procurement information rose from 44.4% to 53.75%. Zaporizhzhia, Lviv, and Poltava made the greatest progress. Zaporizhzhia and Lviv substantially expanded their thematic pages, and Poltava created a “Local Budget” section it had not had before.
The most common change was adding a link to the state Open Budget portal in budget sections. After follow-up monitoring, seven cities in the sample had such a link. Publishing information on consultations with businesses on procurement and holding budget hearings remain among the most problematic areas. Kyiv, Lutsk, Kharkiv, Khmelnytskyi, and Chernihiv have not yet shown significant progress in this block.
The follow-up monitoring shows that the European City Index has become one of the drivers of practical change in cities. In all three areas reviewed again, the average indicator implementation level rose. Cities created new thematic sections and “single points of entry,” structured their information, and added documents, data, and links that were missing at the first assessment. The greatest progress generally came from cities that worked with the roadmaps and stayed in contact with the program team.
Progress remains uneven, however. Changes to how information is structured and made accessible happen fastest. Practices that require new procedures, new services, or regular engagement with residents and businesses take longer. The progress recorded so far is therefore the beginning of a systemic transformation, not its completion. It should be sustained through further monitoring, consultations, and public comparison of results.
Details and results of each study are available via the links below or in the attached PDF.
European City Index 2025: Thematic findings and recommendations

This research was prepared with the support of the MATRA Programme of the Embassy of the Kingdom of the Netherlands in Ukraine and with financial support from Sweden within the framework of the Transparency International Ukraine institutional development program.
The content of this publication is the sole responsibility of the authors and does not necessarily reflect the official position of the Embassy of the Kingdom of the Netherlands in Ukraine or the Government of Sweden.